Last year, the National Park Service released our report, Artificial night lighting and protected lands: Ecological effects and management approaches (Longcore and Rich 2016), which had been in the works for quite a while. Our colleague Andrej Mohar, while enthusiastic about the report overall, pointed out that a figure that we had included of natural illumination under various conditions was wrong, and by quite a bit, when it came to the levels under a “quarter moon.” This is the story of that error, where it came from, and its correction.
The figure we used in the 2016 NPS report was re-printed with very minor adjustments from Paul Beier’s chapter in our 2006 edited book, Ecological Consequences of Artificial Night Lighting (Island Press).

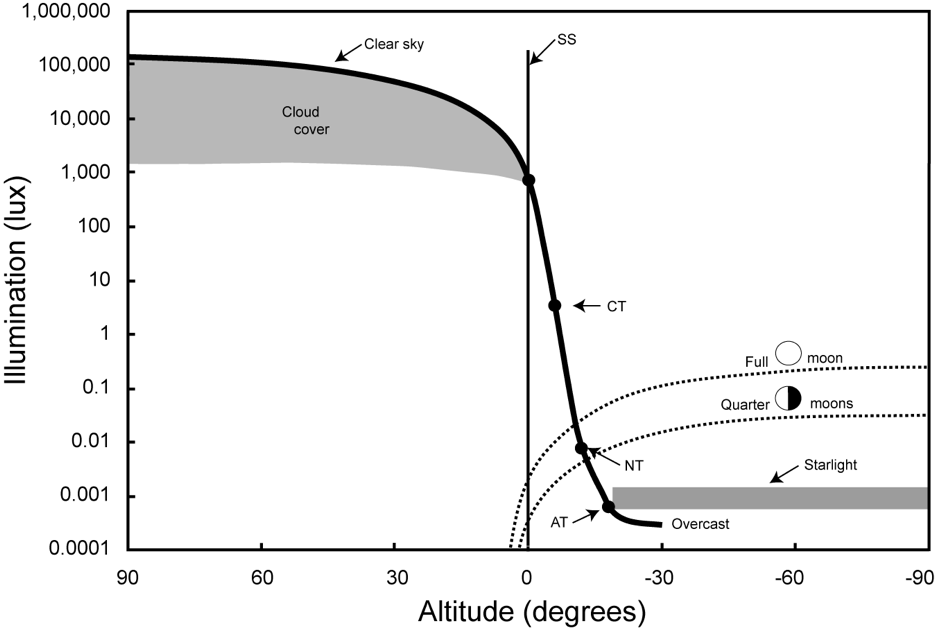
The “quarter moon” is shown as causing ground-based illumination of 0.1 lux or thereabouts. This is obviously and very wrong, and in fact is contradicted in Chapter 1 of the book, which indicates 0.01-0.03 lux for a quarter moon. We should have caught it then, but did not.
Furthermore, a quarter moon, technically, is half of the disk of the moon illuminated, which is one quarter of the entire moon. The icon we used for the “quarter moons” in the figure, however, is that of a crescent moon, with closer to one quarter of the disk illuminated. We had switched the icon for the “quarter moons” from a depiction of three quarters of the disk illuminated to one quarter of the disk illuminated to match this commonsense language.
Beier (2006) had adapted the graphic from McFarland et al. (1999), who cited their sources as Blaxter (1970) and Brown (1952). It was McFarland et al. (1999) who introduced the error. They correctly copied the illumination line from a moon with three-quarters of the face illuminated (a gibbous moon) and incorrectly labeled it as “quarter moons.” They had three-quarters of the face illuminated in the icon, which was correct, but inconsistent with the label.

Compare the figure from McFarland et al. (1999) with the figure produced by Brown for the Department of Navy in 1952. The Brown figure is in footcandles.
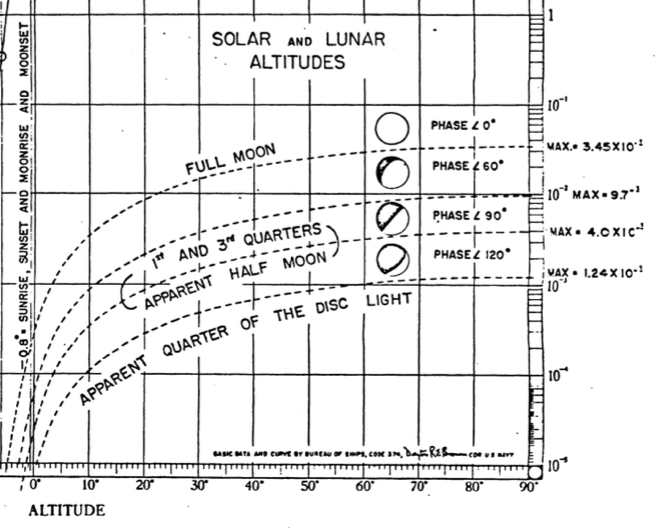
The 1952 Brown report provides curves of illumination from the moon at four phases: full (phase angle 0º), three-quarters full (phase angle 60º), half full (phase angle 90º, which is technically a “quarter moon”) and one-quarter full (phase angle 120º). In the McFarland et al. (1999) diagram, two curves are given: one for the full moon and one for “quarter moons.” The full moon line is correct. The “quarter moons” line is the same as the three-quarters full moon in Brown (1952), meaning that the lunar disk is three-quarters illuminated (phase angle 60º) and not a “quarter moon” in the sense of one quarter of the disk being illuminated or even a quarter moon meaning one quarter of the entire moon visible and illuminated (half of the disk visible and illuminated).
Unfortunately, this error propagated forward to Beier (2006), our 2016 report (which is being reissued with a corrected figure), and Gaston et al. (2014), who changed the icon to a crescent moon (as we did in our report) and might have shifted the line down slightly, but not enough to be accurate, especially given the icon depiction of a crescent moon and textual description.

I regret not catching the error when editing Beier’s chapter or when updating the figure in 2016. But Andrej did catch it and now the record can be set straight.
For the record, the approximate values for the maximum clear-sky illumination from the moon directly overhead at its phases are as follows.
|
Phase Angle |
Brown (1952) (lux) |
(Krisciunas & Schaefer 1991) (lux) |
|
| Full 100% illuminated |
0º |
0.37 |
0.423 |
| Gibbous 75% illuminated |
60º |
0.10 |
0.071 |
| First and Last Quarter 50% illuminated |
90º |
0.043 |
0.028 |
| Crescent 25% illuminated |
120º |
0.013 |
0.008 |
These values can vary based on the distance between the sun and the moon and whether the moon is waxing or waning because of the differing characteristics of the face of the moon. Illuminations this high are unlikely to occur under most circumstances, especially at temperate latitudes. A working estimate of illumination from the full moon is closer to 0.1 lux on the ground than the ~0.4 lux potential maximum illumination, a fact that has been recently discussed by Kyba et al. (2017).
Travis Longcore, Ph.D.
August 5, 2017
Literature Cited
Beier, P. 2006. Effects of artificial night lighting on terrestrial mammals. Pages 19–42 in C. Rich, and T. Longcore, editors. Ecological consequences of artificial night lighting. Island Press, Washington, D.C.
Blaxter, J. H. S. 1970. Light, Animals, Fishes. Pages 213–230 in O. Kinne, editor. Marine ecology: a comprehensive integrated treatise on life in oceans and coastal waters. Wiley-Interscience, London.
Brown, D. R. 1952. Natural illumination charts. Research and Development Project NS 714-100. Pages 1–11, 43 plates. Department of the Navy, Bureau of Ships, Washington, D.C.
Gaston, K. J., J. P. Duffy, S. Gaston, J. Bennie, and T. W. Davies. 2014. Human alteration of natural light cycles: causes and ecological consequences. Oecologia 176:917–931.
Krisciunas, K., and B. E. Schaefer. 1991. A model of the brightness of moonlight. Publications of the Astronomical Society of the Pacific 103:1033–1039.
Kyba, C., A. Mohar, and T. Posch. 2017. How bright is moonlight? Astronomy & Geophysics 58:1.31–31.32.
Longcore, T., and C. Rich. 2016. Artificial night lighting and protected lands: Ecological effects and management approaches. Natural Resource Report NPS/NRSS/NSNS/NRR—2016/1213. National Park Service, Fort Collins, Colorado.
McFarland, W., C. Wahl, T. Suchanek, and F. McAlary. 1999. The behavior of animals around twilight with emphasis on coral reef communities. Pages 583–628 in S. N. Archer, M. B. A. Djamgoz, E. R. Loew, J. C. Partridge, and S. Vallerga, editors. Adaptive mechanisms in the ecology of vision. Kluwer Academic Publishers, Dordrecht.
